
Creating a product isn’t an easy thing. It is hard to make valuable changes to the product that already exists. In both these cases, the Google HEART framework is a perfect solution.
HEART framework is a great fit for any company size. It decides issues according to the user`s expectations, not business goals. It means that it can be used for an early-stage startup, mid, or enterprise company level.
#1 What is Google HEART Framework
So what is Google HEART? This framework is responsible for measuring UX quality for web applications. If a team relies on results, this can help with progress towards key goals and product-related decisions. It is possible to measure as a whole UX of the product or a particular part of it.
So how a UX/UI designer should understand the HEART framework? Here is a definition of each framework first letter: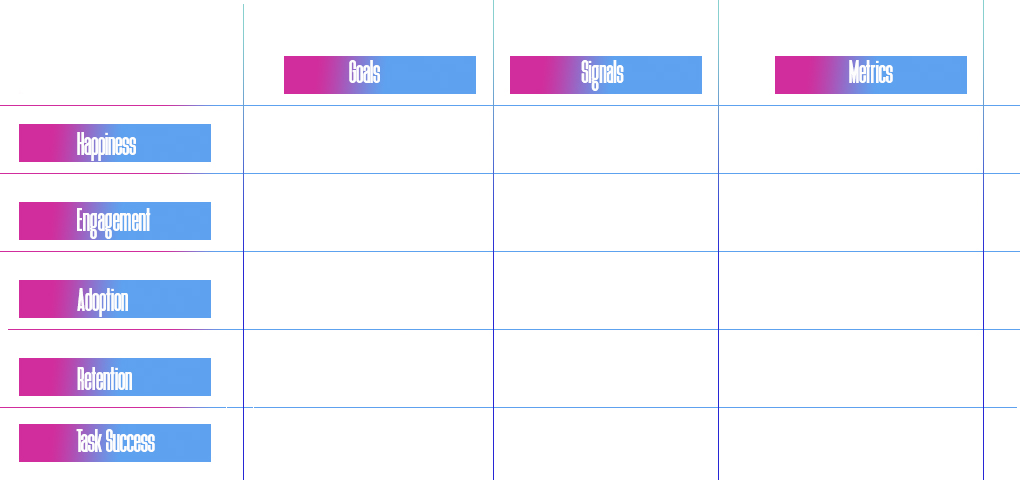
- H-Happiness: Qualitative user experience measurements, such as satisfaction and ease-of-use.
To measure the satisfaction and attitude of the product, happiness is the best category. This provides information about what users feel about the product. The best approach is to use surveys for a target audience. There are general conductive research and micro categories, such as net-promoter score (NPS), the perceived ease of use.
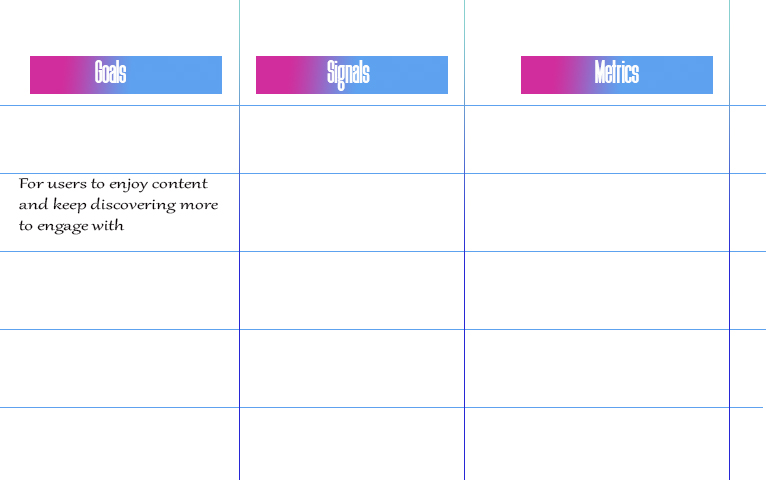
- E-Engagement: frequency, intensity, or depth of interaction over a given timeframe
Engagement is used to measure the interaction of users with a product is a specific timeline. This includes regularity and how frequently the product is used. Also, it measures how intensive are users in some period of time. As an example, it can include a number of visitors per limited period of time — day, week, or month; like or dislike, adding personal data, etc.
- A-Adoption: how many new users of the product, updated feature, gets in a defined time period
Adoption might be not considered as UX, but in most cases, it is a perfect combination of marketing and UX. By inventing new feature adoption metrics shows a result of how it has been accepted by users. It is predictable that not all users might like the update, but adoption measuring can give a great base on what can be improved for users to be accepted.
- R-Retention: how many users stick around and how many do not proceed with using a product
To make people back to your product back and use it, again and again, UX/UI Designers should use retention metrics. It will show the rate of repeated users. If the team integrates a new feature or release a new version of the product, retention shows the level of success for these improvements from the user’s point of view.
T-Task success: traditional behavioral metrics of user experience from Google, like time to task-completion, error rate, etc.
Depending on what part or entire product do the UX/UI team works on, the metrics should be collected for future analysis. Once the data will be collected, there will be the next stage called goals-signals-metrics.
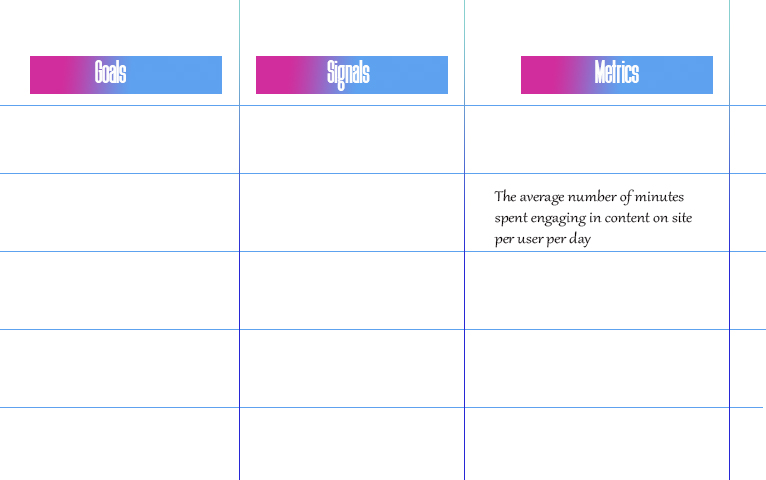
#2 Goals
When a UX/UI designer understands HEART metric types, he can concentrate his/her attention on 1 or 2 of them for working on the product. But how to select the proper metrics? To answer this question, the professional should use goals.
Working on goals implementation is what every team needs. By providing them, the product will be created according to user expectations. Depending on each goal, there will be a unique metric to choose from.
All people have different points of view, so it is predictable that each team member will have his/her own vision. Goals can make this process easier and speed-up work.
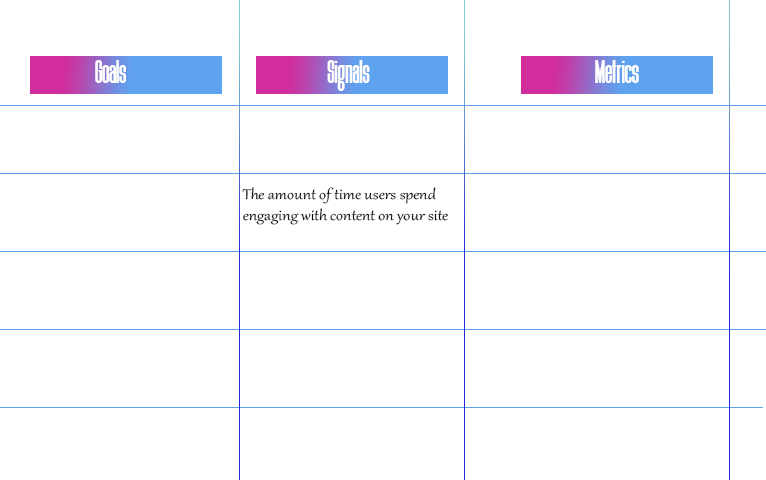
#3 Signals
Signals are UX KPIs, user behavior actions that help a team to track progress for their goals. If there is a union between user actions and goals, these results should be mapped out.
Lower-level signals show which goals have more priority to work on. To work with them, the target audience needs to show high-level interest. Once there will be a group of people with a particular focus, UX/UI designers can take this data to analyze.
If a designer already has information about signals, it is time to analyze data. Analyzing the results, a professional needs to understand which particular signals are the closest to the selected goal.
#4 Metrics
Metrics are the refining stage of signals. Results here have are usually translated into stats, which can be compared with previous results, product, or niche standards.
For validating the final decision, it is useful to start A/B testing for UX/UI designers. It will clarify the direction in case of any doubts. Tracking the testing will minimize the level of risk between features or updates for the product.
Working according to a priority list is an important factor. Designers make a list from top to bottom level priority and start working on them. This will help to not include low-level tasks, which might not benefit the main goal.
An important note is to not use “side stats” during testing. There will be different approaches from users that might not help to make a decision. Professionals need to stick around on particular metrics to avoid unnecessary implementation.
#5 Summary
Whether a company or UX/UI specialist wants to create/improve the product, they should consider using the best methods for it. HEART framework provides the strongest strategy for it. It is possible to use it at every stage of product development, which makes it really flexible and comfortable to use.